Nuclear NAD+homeostasis governed by NMNAT1 prevents apoptosis of acute myeloid leukemia stem cells
2022.11.04
INTRODUCTION
Acute myeloid leukemia (AML) represents heterogeneous myeloid malignancies with poor outcomes and few targeted therapies (1). The standard “7 + 3” induction regimen (7 days of cytarabine and 3 days of daunorubicin treatment) targeting bulk AML cells introduced in 1973 is still used to treat AML in many centers (2). Recent studies have revealed that AML, in particular the leukemia stem cells (LSCs) largely responsible for relapse and therapy resistance (3), has unique metabolic requirements, such as low reactive oxygen species and dependence on oxidative phosphorylation (OXPHOS) and adenosine 5′-monophosphate–activated protein kinase (AMPK), a master regulator of metabolism (4–7). These metabolic dependencies offer potential for therapeutic intervention, as exemplified by the finding that venetoclax, a B-cell lymphoma 2 (BCL-2) inhibitor, suppresses OXPHOS of LSCs to achieve remarkable responses against de novo AML (8–10) but not relapsed/refractory AML (11, 12). These findings underscore the need to identify novel metabolic vulnerabilities in AML, particularly in LSCs, for better therapeutic intervention.
Nicotinamide adenine dinucleotide (NAD+) is a foundational metabolite that is required for a variety of biological processes, including cell survival and genome integrity. In mammals, NAD+ is largely produced via the Preiss-Handler and salvage pathways due to the bioavailability of nicotinic acid (niacin, NA), nicotinamide (NAM), and NAM riboside (NR) from food (13). A branch of the salvage pathway governed by NAM phosphoribosyltransferase (NAMPT), an enzyme that converts NAM to NAM mononucleotide (NMN), has gained attention as a potential cancer target. NAMPT inhibitors such as FK866 showed promising anticancer effects in vitro and in some animal models (14). However, NAMPT inhibitors had limited success in clinical trials (13), potentially due to the ability of NA and NR to bypass the requirement of NAMPT (15).
NAMPT is present in both intracellular and extracellular forms, the latter of which is predominantly produced from adipocytes and exhibits higher enzymatic activity (16). This raises the question of which source of NAMPT to target: NAMPT expressed in the tumors, in the tumor microenvironment, or in distal tissues such as adipocytes. NMN adenylyltransferases (NMNATs) are downstream of NAMPT, which use NMN and NA mononucleotide (NaMN) from NAM, NR, and NA to produce NAD+ directly or indirectly. The three NMNATs have distinct cellular localizations (NMNAT1 in the nucleus, NMNAT2 in the cytoplasm, and NMNAT3 in the mitochondrion) to enable compartmentalized NAD+ biogenesis (17). However, some degree of NAD+ transportation exists between cellular compartments (18). Targeting NMNATs for cancer therapy may circumvent the redundant metabolites feeding into NAD+ production, but to develop new therapies, we must first determine which NMNAT enzyme is required for cancer cells.
In this study, we integrated whole-genome CRISPR screening and pan-cancer genetic dependency mapping and identified NAMPT and NMNAT1 as AML dependencies governing NAD+ biosynthesis. LSCs had increased expression of NAMPT, which contributed to the higher levels of NAD+ than non-LSCs and promoted AML progression. While the presence of NAD+ precursors circumvented the requirement of NAMPT, AML remained dependent on NMNAT1, pointing to NMNAT1 as a gatekeeper of NAD+ metabolism. Deletion of NMNAT1 reduced nuclear NAD+, activated p53 due to attenuated deacetylation by SIRT6/7, and sensitized AML to venetoclax. In contrast to LSCs, which depend on NMNAT1 for their maintenance, normal hematopoiesis and hematopoietic stem cells (HSCs) did not depend on NMNAT1. Our study highlights NMNAT1 as a previously unidentified genetic dependency in AML LSCs that prevents p53 activation by promoting NAD+ biosynthesis.
RESULTS
The NAD+ salvage pathway is required for AML
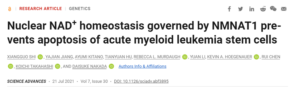
To identify novel genetic dependencies in AML, we performed a CRISPR dropout screening in the MOLM13 human AML cell line. We transduced a single clone of MOLM13 cells expressing Cas9 with a human genome-wide CRISPR library consisting of 90,709 single guide RNAs (sgRNAs) targeting 18,010 genes. The cells were harvested at 10 and 25 days after transduction for sequencing, and the sgRNA depletion and enrichment was analyzed with the MAGeck package (Fig. 1A; fig. S1, A and B; and table S1) (19). By comparing the sgRNA abundance at day 10 and input, we identified 1889 genes essential for AML [false discovery rate (FDR) < 0.25] (fig. S1C). These genes were enriched for essential biological processes, including nucleic acid synthesis, translational initiation, and ribosomal RNA processing, similar to a report from previously performed essentiality screen (20). Our screen also identified 1665 genes that were further depleted from days 10 to 25 (FDR < 0.25), which were enriched for metabolic processes, such as amino acid, coenzyme, folic acid, vitamin, and carboxylic acid metabolism (fig. S1C). We identified known positive regulators of AML such as BCL2, BRD4, MYC, FLT3, and DHODH, as well as negative regulators such as TP53, CDKN1B, and CDKN2C in this analysis (Fig. 1B).
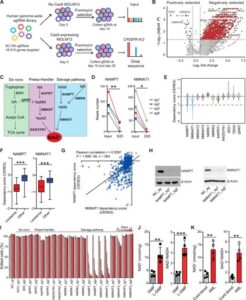
Fig. 1 Whole-genome CRISPR screen identifies NAMPT and NMNAT1 as genetic dependencies in AML.
(A) A schematic outline of the genome-wide CRISPR-Cas9 screen. (B) A volcano plot showing both positively and negatively selected genes (FDR < 0.25). (C) A schematic showing the three NAD+ biosynthesis pathways, with metabolites and enzymes in normal and italic font, respectively. (D) The read numbers of four sgRNAs against NAMPT (left) and NMNAT1 (right) at day 25 compared to input. (E) Cancer cell line dependency scores (CERES) of genes involved in NAD+ biosynthesis (n = 563). The box plot presents interquartile range, and the whiskers show 95% confidence interval. (F) CERES of NAMPT and NMNAT1 in leukemia (n = 26) and other cancer cell lines (n = 505). Box plots are annotated with the lower quartile, median, and upper quartile for each category’s z scores. (G) Scatter plot showing the correlation between the dependency score of NAMPT and NMNAT1 (n = 563). (H) Immunoblots of NAMPT (left) and NMNAT1 (right) in MOLM13 cells at day 4 after deleting these genes. (I) Competitive growth assay in Cas9-expressing MOLM13 cells that express sgRNAs against negative control (NC) or genes in the NAD+ biosynthesis pathway. The percentages of sgRNA-expressing cells were normalized to those on day 4 after transduction. (J) Measurement of intracellular NAD+ amounts (left) and NAD+/NADH (reduced form of NAD+) ratio (right) in GMP and MLL-AF9–driven L-GMPs (n = 4). (K) Intracellular NAD+ amounts (left) and NAD+/NADH ratio (right) in human cord blood CD34+ HSPCs and PDX-derived AML samples (n = 4). All data represent mean ± SD; *P < 0.05, **P < 0.01, and ***P < 0.001 by unpaired Student’s t test unless otherwise noted. See also fig. S1.
Expand for more
To find novel therapeutic targets for AML, we used the drug gene interaction database (http://dgidb.org/search_categories) and found 430 genes from the dropout gene list that encode druggable targets (table S2). We focused our attention to the NAD+ biosynthesis pathway, which has been reported as a dependency in many solid tumors (15). We found that two genes involved in the NAD+ salvage pathway, Nicotinamide Phosphoribosyltransferase (NAMPT) and Nicotinamide Nucleotide Adenylyltransferase 1 (NMNAT1), exhibited significant dropout in the screen (Fig. 1, C and D). NAMPT is an enzyme that converts NAM to NMN, while NMNAT1 converts NMN to NAD+ (Fig. 1C).
To systematically analyze the dependency of all genes involved in the NAD+ biosynthesis pathway across broad types of cancer, we used the DepMap dataset (https://depmap.org/portal/) that curates whole-genome CRISPR screening data in more than 500 cancer cell lines (21). We found that more than 20% of all cancers depend on NAMPT and NMNAT1 but not NMNAT2, NMNAT3, or genes involved in the Preiss-Handler or the de novo synthesis pathways (Fig. 1E). Further analysis of the dependency across cancers revealed that leukemia and other hematologic malignancies, such as lymphoma and multiple myeloma, are highly dependent on these two genes compared to other cancers (Fig. 1F and fig. S1, D and E). Moreover, NAMPT and NMNAT1 exhibited remarkable codependency among 563 cancer cell lines, consistent with the notion that NAMPT and NMNAT1 function in the same pathway (Fig. 1G and fig. S1F). To validate the unique dependency of AML on NAMPT and NMNAT1 within other genes involved in NAD+ biosynthesis, we designed two sgRNA per gene for a total of 10 genes involved in the de novo, Preiss-Handler, and salvage synthesis pathways and assessed their requirement in MOLM13 cells. Deletion of NAMPT or NMNAT1, but not other genes that regulate NAD+ biosynthesis, reduced the number of edited cells over time, confirming their requirement in AML (Fig. 1, H and I). Corroborating the importance of the NAD+ biosynthesis in AML, we found that NAD+ is more abundant in L-GMPs, the LSC population in the MLL-AF9–induced AML murine model (22), than normal in GMPs (Fig. 1J). Patient-derived AML cells with different genotypes also had more NAD+ compared to cord blood CD34+ normal hematopoietic stem and progenitor cells (HSPCs) (Fig. 1K).Thus, our genome-wide CRISPR screen in AML and cancer dependency analysis across hundreds of cancer cell lines unveiled the requirement of two components in the NAD+ salvage pathway, NAMPT and NMNAT1, in AML.
NMNAT1 acts as a gatekeeper in NAD+ homeostasis and AML survival
NAMPT is considered to be the rate-limiting enzyme in the NAD+ salvage pathway and has been demonstrated as a therapeutic target in multiple cancers with several inhibitors being developed. However, clinical trials with these inhibitors achieved limited success (13), potentially due to uptake of NAD+ precursors that bypass the requirement of NAMPT (15). For example, NR is phosphorylated by NR kinases 1 and 2 (NMRK1/2) to produce NMN (independently of NAMPT), which is used by NMNAT for NAD+ biosynthesis (Fig. 1C) (17). Since NMNAT1 catalyzes the last step in NAD+ biosynthesis, in which NMN produced by NAMPT and NMRK is converted to NAD+, we hypothesized that NMNAT1 may constitute an AML dependency that cannot be bypassed by NAD+ precursors.
To test this hypothesis, we treated MOLM13 and OCI-AML2 AML cell lines with FK866, a specific inhibitor of NAMPT, with or without NAD+ precursors NMN, NA, NR, or NAM. FK866 potently reduced cell viability of these two AML cell lines (Fig. 2A). However, supplementation of NAD+ precursors significantly reduced the toxicity of FK866 (Fig. 2A and fig. S2, A and B). This effect was not due to an off-target effect of FK866, since NAD+ precursors also rescued the diminished cell expansion following deletion of NAMPT with CRISPR-Cas9 (fig. S2C). Deletion of NMNAT1 with CRISPR-Cas9 also significantly impaired expansion of four AML (THP1, NB4, OCI-AML2, and MV4-11) and a CML (K562) cell lines, but not pancreatic or breast cancer cells (fig. S2, D and E). NAD+ precursors failed to improve the defective expansion of NMNAT1-deleted cells (Fig. 2B). Thus, NAD+ precursors available in physiological settings cannot rescue the dependency of AML on NMNAT1.
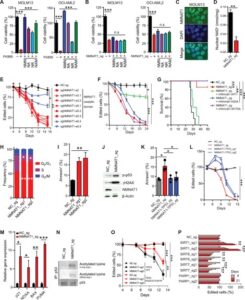
Fig. 2 NMNAT1 deletion decreases nuclear NAD+ and activates the p53 pathway.
(A) Viability of MOLM13 and OCI-AML2 cells treated with FK866 (10 μM) with or without NAD+ precursors (NMN, NA, NR, and NAM; 1 mM). (B) Viability of MOLM13 and OCI-AML2 cells transduced with NMNAT1_sg (+) or negative control sgRNA [NC_sg (−)] with or without NAD+ precursors (NMN, NA, NR, and NAM; 1 mM). (C) Immunofluorescence images of NMNAT1 in MOLM13 cells. (D) Nuclear NAD+ levels in MOLM13 cells after deleting NMNAT1 or a negative control (NC) locus. (E) CRISPR domain screening using sgRNAs targeting different exons of NMNAT1 in Cas9-expressing MOLM13 cells. (F) Relative expansion of MOLM13 cells transduced with sgRNA against NMNAT1 or NC with or without the indicated mouse Nmnat1 constructs. (G) Survival curves of NSG-SGM3 mice transplanted with control or NMNAT1-deleted MOLM13 cells with the indicated murine Nmnat1 constructs. (H and I) Cell cycle analysis by BrdU incorporation (H) and annexin V staining (I) of MOLM13 cells after deleting NMNAT1 or NC. (J) Immunoblotting showing phospho-p53, γH2AX, and NMNAT1 in MOLM13 cells after lentiviral deleting NMNAT1. (K and L) Annexin V staining (K) or relative expansion (L) of MOLM13 cells after deleting NMNAT1 with or without consecutive targeting of TP53. (M) Relative expression of p53 target genes after deleting NMNAT1. (N) Immunoprecipitation assay showing increased acetylated lysine of p53 in NMNAT1-deleted MOLM13 cells. (O) Relative expansion of NMNAT1-deleted MOLM13 cells expressing WT or K320/373/381R-TP53 constructs. (P) Competitive growth assay after deleting the indicated genes. All data represent mean ± SD; *P < 0.05, **P < 0.01, and ***P < 0.001 by unpaired Student’s t test unless otherwise noted. See also fig. S2.
Expand for more
The catalytic activity of NMNAT1 is required for AML
Previous studies have shown that NMNAT1 localizes to the nucleus and binds both NMN and adenosine 5′-triphosphate (ATP) via its acetyltransferase domain to produce NAD+ (23–25). Consistently, NMNAT1 protein was localized to the nucleus of MOLM13 cells and its deletion significantly reduced nuclear NAD+ (Fig. 2, C and D). Moreover, screening the NMNAT1 protein domain essentiality with eight sgRNA sequences showed that sgRNAs targeting the acetyltransferase domain, but not the C-terminal tail, significantly reduced survival of AML cells (Fig. 2E). To specifically determine whether the catalytic activity of NMNAT1 is required for its function, we expressed murine Nmnat1 (which is resistant to sgRNA against human NMNAT1) with mutations in tryptophan-170 (W170A) or histidine-24 (H24A), which impair binding to NMN or ATP, respectively (24), into NMNAT1-ablated MOLM13 cells. While wild-type (WT) murine Nmnat1 largely rescued the decline of NMNAT1-ablated cells in culture, Nmnat1 with W170A or H24A mutations failed to rescue the phenotype, indicating that the catalytic activity of NMNAT1 is essential for its function (Fig. 2F and fig. S2F).
To determine whether NMNAT1 and its catalytic function are essential for AML in vivo, we first transplanted MOLM13 cells with or without ablation of NMNAT1 into immunocompromised mice. In contrast to mice transplanted with control MOLM13, which all developed AML within 33 days after transplantation, mice infused with NMNAT1-ablated MOLM13 rarely developed AML (Fig. 2G). This defective leukemogenesis of NMNAT1-ablated MOLM13 cells was rescued by expressing murine WT Nmnat1 but not Nmnat1 with mutations (W170A or H24A) in the catalytic domain (Fig. 2G and fig. S2G). Together, these results establish that the catalytic function of NMNAT1 is essential for AML.
NMNAT1 deletion activates p53 in AML
We then determined whether NMNAT1 regulates cell cycle, apoptosis, or differentiation of AML cells. Bromodeoxyuridine (BrdU) incorporation assays showed that NMNAT1-deficient AML cells exhibited increased proportion of G0/G1 phase and reduced S phase, suggesting that AML undergoes cell cycle arrest (Fig. 2H). Moreover, deletion of NMNAT1 caused apoptosis (Fig. 2I). Gene expression and flow cytometry analyses shortly after NMNAT1 deletion did not detect significant increases in myeloid transcription factors or differentiation markers (fig. S2H). Immunoblotting showed that NMNAT1-deficient AML cells had increased levels of phospho-p53 and DNA damage response marked by γH2AX (Fig. 2J and fig. S2I). Expression of WT murine Nmnat1 diminished induction of γH2AX, demonstrating that off-target effects of the CRISPR-Cas9 system did not induce the DNA damage response in NMNAT1-deficient cells (fig. S2J).
To determine whether p53 mediates apoptosis upon NMNAT1 deletion, we simultaneously deleted NMNAT1 and TP53 with a dual guide CRISPR method. Codeletion of TP53 significantly reduced the frequency of apoptotic cells and improved the survival of NMNAT1-ablated AML cells, although NMNAT1/TP53 double-mutant cells were gradually outcompeted by unedited cells (Fig. 2, K and L). Consistent with the activation of p53 in NMNAT1-deficient AML, we detected increased expression of p53 target genes, such as CDKN1A (p21), NOXA, BAX, and PUMA (Fig. 2M and fig. S2K). We found that NMNAT1-deficient AML cells have increased acetylation of p53 (Fig. 2N and fig. S2L). Acetylation of p53 increases its DNA binding and transcriptional activity and is governed by acetyltransferases [p300/CBP (CREB-binding protein) and TIP60/MOF] and deacetylases, including NAD+-dependent sirtuins that are localized to the nucleus: SIRT1, SIRT6, and SIRT7 (26–30). We thus deleted SIRT1, SIRT6, or SIRT7 to examine whether they regulate apoptosis in AML. Deletion of SIRT6 or SIRT7, but not SIRT1, increased apoptosis and impaired the expansion of AML cells (Fig. 2O and fig. S2M). Consistent with prior findings, p53 interacted with SIRT6/7 in AML (fig. S2N). Mutating lysine-320, -373, and -381 of p53, the known SIRT6/7 deacetylation sites, to arginine (K320/373/381R) to prevent acetylation partially improved the defective growth of NMNAT1-deleted AML cells (Fig. 2O and fig. S2O). Deletion of poly(adenosine 5′-diphosphate–ribose) polymerase 1 (PARP1), the predominant PARP family protein that consumes large amount of NAD+ in the nucleus (31), did not affect survival of MOLM13 cells (Fig. 2P). These data suggest that NMNAT1 prevents p53 activation by safeguarding p53 acetylation at least partly through NAD+-dependent SIRT6/7.
NMNAT1 deletion sensitizes AML to venetoclax treatment
Recent studies demonstrated that p53-mediated apoptotic responses modulate the sensitivity of AML to venetoclax, a recently approved AML therapy that causes apoptosis by inhibiting BCL-2 (9–11). It has been shown that p53 activation with a MDM2 inhibitor sensitized AML cells against venetoclax, while deleting p53 rendered cells resistant to venetoclax (32, 33). Our finding that impaired NAD+ homeostasis upon NMNAT1 deletion activates p53 raised the possibility that NAD+ levels may be associated with resistance to chemotherapies, including venetoclax.
To test this hypothesis, we integrated the Genomics of Drug Sensitivity in Cancer dataset (34) (https://cancerrxgene.org/) and the cancer cell line metabolism landscape (35) of 53 cell lines derived from hematological malignancies. We associated the half maximal inhibitory concentration (IC50) against 395 drugs with the metabolomics profiles of the 53 cell lines and ranked 225 metabolites based on their impact on drug sensitivity, as determined by the cumulative Pearson correlation coefficient. NAD+ ranked fourth on this list, and its cellular concentration exhibited significant positive correlation with IC50 of many drugs (Fig. 3A, fig. S3A, and table S4). Querying for drugs whose IC50 positively correlate with cellular NAD+ abundance revealed that venetoclax was the most significantly correlated drug among the 395 analyzed (Fig. 3, B and C; Pearson correlation r = 0.605, P = 6.8 × 10⁶; table S4). To confirm this association, we treated MOLM13 cells with venetoclax with or without NAD+ precursors and examined apoptosis. As shown in Fig. 3D, NAD+ precursors rendered MOLM13 cells more resistant to venetoclax treatment. Furthermore, supplementing NAD+ precursors in vitro ameliorated the effect of venetoclax in reducing cell viability of L-GMPs (Fig. 3E). We then tested whether impaired NAD+ homeostasis makes AML cells more sensitive to venetoclax. Treating MOLM13 cells with FK866 rendered cells more sensitive to venetoclax, suggesting that NAD+ homeostasis protects cells from venetoclax (Fig. 3F). Moreover, NMNAT1-deficient AML cells were sensitive to venetoclax, exhibiting diminished cell viability even at doses that minimally affected unedited AML cells (Fig. 3G). Consistently, NAMPT and NMNAT1 were included in the dropout gene list in a recent CRISPR screen searching for genes that rendered AML cells sensitive to venetoclax when deleted (fig. S3B) (36). As shown before (32, 33, 36), TP53-deficient AML cells were resistant to venetoclax (fig. S3C). However, TP53 deletion was only able to partially rescue the venetoclax sensitivity of NMNAT1-deleted cells, and NMNAT1/TP53 double-knockout (KO) cells eventually became exhausted (Fig. 2L and fig. S3D). Together, these results establish the association between NAD+ levels and venetoclax resistance in AML.
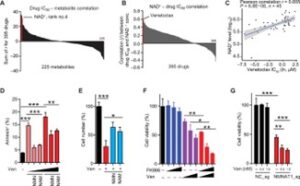
Fig. 3 NMNAT1 deletion sensitizes AML cells to venetoclax.
(A) Waterfall plot showing the sum of drug metabolite Pearson correlation in 53 hematopoietic malignancy cell lines. Pearson correlation r value was calculated between the concentration of metabolite and drug IC50 in the 53 cell lines. The x axis represents 225 metabolites, and the y axis represents the sum of all Pearson correlation r values for all the 395 drugs. The bar in red color indicates NAD+, which is ranked fourth among 225 metabolites. (B) Waterfall plot showing the Pearson correlation r values (x axis) between the concentration of cellular NAD+ and IC50 of 395 drugs (y axis) in 53 hematopoietic malignancy cell lines. The bars in red color indicate venetoclax, which is ranked first among 395 drugs. (C) Plot showing the Pearson correlation between cellular NAD+ levels and venetoclax IC50 from 45 hematopoietic malignancy cell lines. Each dot represents one cell line. (D) Frequency of apoptotic MOLM13 cells treated with venetoclax (Ven, 1.5 to 3 nM) with or without NMN or NAM (1 mM) for 48 hours. (E) Effect of Ven (3 nM) on cell growth of MLL-AF9–driven L-GMPs with or without NMN or NAM (1 mM) supplementation for 72 hrs. (F) Cell viability of MOLM13 cells treated with FK866 (0.625 to 2.5 nM) or Ven (0.75 to 3 nM) alone or in combination for 48 hours. (G) Cell viability of MOLM13 cells after deleting NMNAT1 or the control locus and treated with the indicated concentration of Ven for 48 hours. All data represent mean ± SD; *P < 0.05, **P < 0.01, and ***P < 0.001 by unpaired Student’s t test unless otherwise noted. See also fig. S3.
Expand for more
NMNAT1 depletion suppresses leukemogenesis in vivo
To examine whether NMNAT1 regulates leukemogenesis, we deleted Nmnat1 or the control Rosa26 locus from murine MLL-AF9–induced AML cells by CRISPR and transplanted them into irradiated mice, as previously described (37, 38). Immunoblotting confirmed efficient depletion of NMNAT1 protein (fig. S4A). Ablation of Nmnat1 significantly delayed the onset of leukemogenesis, ameliorated leukocytosis, and reduced the frequency of AML cells marked by green fluorescent protein (GFP) expression, indicating that Nmnat1 is required for leukemogenesis in mice (fig. S4, B and C).
We then examined the Nmnat1 dependency of AML using a conditional KO model (39). We crossed Nmnat1fl mice with Mx1-Cre mice to generate Mx1-Cre;Nmnat1fl/fl, Mx1-Cre;Nmnat1+/fl, and control mice (Mx1-Cre;Nmnat1+/+, Nmnat1+/fl, or Nmnat1fl/fl), which were treated with polyinosinic:polycytidylic acid [poly(I:C)] to induce Cre (hereafter referred to as Nmnat1 KO, Het, and WT). We confirmed efficient deletion of the floxed exon in peripheral blood (PB) by polymerase chain reaction (PCR) (fig. S4D). We then isolated HSPCs and transduced the cells with MLL-AF9 retrovirus (coexpressing GFP) followed by transplantation. Mice receiving MLL-AF9–transformed Nmnat1 Het or KO cells exhibited significantly extended leukemia-free survival and reduced frequency of GFP+ AML cells in PB compared to WT recipient mice in an allelic dose-dependent manner (Fig. 4, A and B). Recipient mice transplanted with Nmnat1 KO AML cells exhibited residual Nmnat1fl alleles when they became moribund, suggesting that Nmnat1 KO AML cells are under a negative selective pressure (fig. S4E). The numbers of L-GMPs in the bone marrow (BM) of mice transplanted with Nmnat1 KO AML were significantly reduced compared to WT AML recipient mice (Fig. 4C). Moreover, Nmnat1 deletion reduced nuclear NAD+ levels in freshly isolated AML cells (Fig. 4D). Nmnat1 deletion increased phosphorylated p53 and DNA damage as assessed by γH2AX, and increased expression of p53 target genes (Fig. 4, E to G). To determine the frequency of LSCs, we performed limiting dilution assay (LDA) by transplanting a range of AML BM cells isolated from Nmnat1 WT or Het primary recipient mice into secondary recipients (Fig. 4H). This analysis revealed that Nmnat1 Het AML recipient mice had at least 15 times fewer LSCs (1 in 11,786 cells in Nmnat1 Het versus 1 in 764 in Nmnat1 WT) than Nmnat1 WT AML mice (Fig. 4H and fig. S4F). These results establish that LSCs are sensitive to Nmnat1 gene dosage, such that a partial reduction in NMNAT1 function by NMNAT1 heterozygosity impairs LSC function.
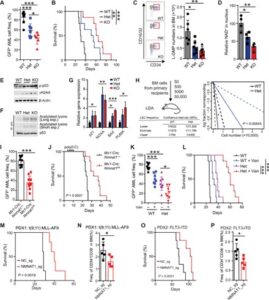
Fig. 4 NMNAT1 deletion suppresses leukemia progression.
(A and B) Frequency of GFP+ leukemia cell in blood (day 25) (A) and survival curve (B) of mice transplanted with MLL-AF9–transduced HSPCs isolated from Nmnat1 WT, Het, and KO mice (n = 8). (C) Representative fluorescence-activated cell sorting plot and quantification of CD34+CD16/32+ L-GMPs (red box) after Nmnat1 deletion (n = 6). (D) Relative nuclear NAD+ levels in GFP+ leukemic cells (n = 4). (E and F) Immunoblotting showing phospho-p53 (Ser15) and γH2AX (E) and acetylated (lysine) p53 after immunoprecipitation of p53 (F) in L-GMPs. (G) Expression levels of p53 target genes in L-GMPs from Nmnat1 WT, Het, and KO AML mice. (H) Limiting dilution assays performed with GFP+ BM cells from primary recipient mice (n = 6). (I and J) MLL-AF9–transduced HSPCs from Mx1-Cre;Nmnat1+/+ or Mx1-Cre;Nmnat1fl/fl mice before poly(I:C) treatment were transplanted into recipient mice and treated with poly(I:C) (indicated by arrowheads) 5 days after transplantation. Frequency of GFP+ leukemia cell in blood 3 weeks after transplantation (I), and survival curves (J) are shown (n = 10). (K and L) Frequency of GFP+ leukemia cell in PB (K) and survival curves (L) (n = 8) of Nmnat1 WT or Het AML recipient mice treated with vehicle or venetoclax (100 mg/kg, days 5 to 21). (M to P) Survival curves (M and O) and frequency of human CD45+CD34+CD38− LSCs (N and P) in NSG-SGM3 mice transplanted with MLL-AF9 (M and N) or FLT3-ITD (O and P) human AML samples with or without CRISPR-mediated deletion of NMNAT1 (n = 5 to 6). All data represent mean ± SD; *P < 0.05, **P < 0.01, and ***P < 0.001 by unpaired Student’s t test unless otherwise noted. See also fig. S4.
Expand for more
We found the AML model induced by the MOZ-TIF2 oncogene also required Nmnat1, indicating the requirement of Nmnat1 is not specific to the MLL-AF9–induced AML model. As shown before, transplantation of HSPCs transduced with MOZ-TIF2–expressing retrovirus caused lethal AML (6, 40). Similar to the MLL-AF9–induced AML model, we found that AML caused by MOZ-TIF2 exhibited increased NAD+ levels and NAD+/NADH (reduced form of NAD+) ratio compared to normal BM cells (fig. S4G), and deleting Nmnat1 significantly delayed the onset and attenuated the penetrance of AML (fig. S4H).
Next, we examined whether established AML depends on Nmnat1. We first established AML by transforming Mx1-Cre;Nmnat1+/+ and Mx1-Cre;Nmnat1fl/fl cells [before poly(I:C)] with MLL-AF9 and transplanting cells into irradiated mice. We next transplanted AML from these primary recipient mice into secondary recipient mice, which we treated with poly(I:C) to delete Nmnat1. Deleting Nmnat1 in established AML significantly reduced the frequency of AML cells in the PB and extended survival (Fig. 4, I and J), demonstrating that NMNAT1 plays an important role in the maintenance of MLL-AF9–driven AML.
Our findings that NAD+ levels correlate with venetoclax resistance and that deleting NMNAT1 sensitized AML cells to venetoclax in vitro (Fig. 4) prompted us to test whether reducing the function of NMNAT1 sensitizes AML to venetoclax in vivo. We thus generated cohorts of recipient mice transplanted with Nmnat1 WT or Het AML driven by MLL-AF9. These recipient mice were then treated with or without venetoclax (100 mg/kg per day) from days 5 to 21 after transplantation. Venetoclax treatment significantly reduced the frequencies of AML cells in the blood of both Nmnat1 WT and Het AML recipient mice (Fig. 4K) and extended median leukemia-free survival of Nmnat1 WT AML recipient mice from 25 to 32 days. However, venetoclax was more potent in extending the median survival of mice with Nmnat1 Het AML (38.5 to 60 days; Fig. 4L). These effects correlated with reduced numbers of AML cells in the blood of Nmnat1 Het AML recipients treated with venetoclax compared to Nmnat1 WT recipients (Fig. 4K). Thus, reducing NMNAT1 function sensitizes AML to venetoclax.
We then examined whether NMNAT1 is required for human AML development in vivo. To this end, we generated two AML patient-derived xenograft (PDX) models, one with t(9;11) translocation resulting in a MLL-AF9 fusion gene and another with a FLT3-ITD mutation (41, 42). Transplanting these patient-derived cells into immunocompromised NSG-SGM3 mice led to lethal AML (7, 43). Electroporation of Cas9 protein together with sgRNA against NMNAT1 (or negative control) resulted in efficient deletion of NMNAT1 gene, leading to the depletion of approximately 90% of NMNAT1 protein and impaired expansion in vitro (fig. S4I). In both PDX models, NSG-SGM3 mice receiving NMNAT1-edited cells had reduced AML expansion in the BM and CD34+CD38− LSCs, as well as extended survival compared to mice receiving AML edited for a control locus (Fig. 4, M to P, and fig. S4, J and K). Together, these AML PDX studies establish that NMNAT1 promotes human AML.
NMNAT1 is dispensable for HSCs
To better understand the role of NMNAT1 in normal hematopoiesis, we first measured the level of Nmnat1 mRNA in hematopoietic populations including HSCs, HSPCs, and mature hematopoietic cells. Compared to whole BM, the expression of Nmnat1 mRNA was higher in HSCs, immature HSPCs, lymphocytes, and erythroid cells (Fig. 5A). We next determined the impact of Nmnat1 deletion on hematopoiesis by analyzing Mx1-Cre;Nmnat1+/+, Mx1-Cre;Nmnat1+/fl, and Mx1-Cre;Nmnat1fl/fl mice. We confirmed deletion of Nmnat1 after poly(I:C) induction by PCR analysis in HSC-derived colonies (fig. S5A). Four months after poly(I:C) injection, PB analyses of Nmnat1 Het and KO mice showed comparable numbers of white blood cells (WBC), red blood cells (RBC), hemoglobin (HGB), and slightly increased platelets (PLT) compared to Nmnat1 WT mice (Fig. 5B). Nmnat1 KO mice had fewer B cells and more T and myeloid cells in PB and a modest increase in BM myeloid cells compared to WT mice, although loss of Nmnat1 did not affect the total number of BM cells (Fig. 5, C and D, and fig. S5B). Consistent with increased myeloid cells in BM, Nmnat1-deficient mice showed increased frequency of myeloid progenitors (granulocyte-macrophage progenitors and common myeloid progenitors) but did not change the frequencies of immature HSPCs in the BM, including HSCs and multipotent progenitor cells (MPPs) (Fig. 5, E and F). Thus, HSCs and steady-state hematopoiesis are maintained in the absence of Nmnat1.
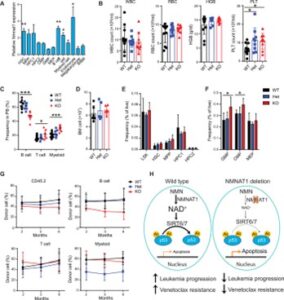
Fig. 5 Nmnat1 is dispensable for normal hematopoiesis.
(A) Quantitative PCR showing the relative expression levels of Nmnat1 in murine hematopoietic cell populations in the BM compared to whole BM (WBM) (n = 3). (B and C) Complete blood cell counts (B) and frequencies of B cell, T cell, and myeloid cell (C) in PB of Nmnat1 WT (Nmnat1+/+), Het (Mx1-Cre; Nmnat1+/fl), and KO (Mx1-Cre; Nmnat1fl/fl) mice at 4 months after poly(I:C) injection (n = 8 to 12). WBC, white blood cells; RBC, red blood cells; HGB, hemoglobin; PLT, platelets. (D) BM cellularity of poly(I:C)-treated Nmnat1 WT, Het, and KO mice (n = 5 to 6). (E) Frequencies of LSK, HSC, MPP, HPC1, and HPC2 in the BM of poly(I:C)-treated Nmnat1 WT, Het, and KO mice (n = 5 to 6). (F) Frequencies of GMP, CMP, and MEP in the BM of poly(I:C)-treated Nmnat1 WT, Het, and KO mice (n = 5 to 6). (G) Competitive BM transplantation with 500,000 Nmnat1 WT, Het, or KO BM cells (CD45.2+), along with 500,000 competitor BM cells (CD45.1+) into lethally irradiated recipient mice. Graphs show the overall percentage of CD45.2+ cells and those in B, T, and myeloid lineages (n = 5 to 6). (H) Model for the role of NMNAT1 in AML and venetoclax resistance. All data represent mean ± SD; *P < 0.05, **P < 0.01, and ***P < 0.001 by unpaired Student’s t test unless otherwise noted. See also fig. S5.
Expand for more
Last, to investigate the regenerative potential of Nmnat1-deficient HSCs, we performed long-term competitive transplantation assays by transplanting whole BM cells from Nmnat1 WT, Het, and KO mice into lethally irradiated recipient mice. Nmnat1 KO cells exhibited multilineage long-term reconstitution of all three lineages studied (B, T, and myeloid cells), with only a trend toward reduced B cell lineage contribution, consistent with the reduced B cells in the PB of Nmnat1 KO mice (Fig. 5G). Genotyping of the donor-derived cells showed that regenerating cells were deleted for Nmnat1 (fig. S5C). Together, these results establish that Nmnat1 is dispensable for normal hematopoiesis.
DISCUSSION
Understanding genetic dependency in AML and the mechanisms by which these dependencies drive disease progression is critical to developing novel therapeutics. Here, through a whole-genome CRISPR screening and pan-cancer dependency mapping analysis, we identify NMNAT1 as a previously unidentified therapeutic target for AML. Disruption of NMNAT1 reduced nuclear NAD+ levels and induced apoptosis partially through inactivation of sirtuin family proteins, particularly SIRT6/7, which deacetylates and keeps p53 under control (Fig. 5H). Deletion of NMNAT1 suppressed AML by reducing LSCs in both murine and PDX models and sensitized AML to venetoclax treatment. The finding that NMNAT1 is dispensable for normal hematopoiesis further supports NMNAT1 as a therapeutic target for AML.
Past studies have highlighted the dependence of many cancers on NAD+ metabolism, with particular focus on NAMPT, an enzyme considered to be rate limiting in the NAD+ salvage pathway (15, 44). These studies led to the development of several small molecular inhibitors targeting NAMPT. However, NAMPT inhibitors had little success in clinical trials for several solid tumors (13), suggesting that targeting other components in the NAD+ biosynthesis pathway may achieve better responses. Our findings reveal that NAD+ precursors present in the serum and diet can substantially rescue the antineoplastic effects of NAMPT deletion or pharmacological inhibition. These results suggest that NAD+ precursors can maintain levels of NAD+ independently of NAMPT. However, NAD+ precursors failed to rescue the effects of NMNAT1 deletion, establishing NMNAT1 as an indispensable gatekeeper in NAD+ biosynthesis. Since the enzymatic activity of NMNAT1 is required for its function, NMNAT1 inhibitors may prove effective in suppressing NAD+ biosynthesis in cancer cells even in the presence of physiological NAD+ precursors.
Our study points to a role for NAD+-dependent deacetylases SIRT6/7 as potential key downstream targets of NMNAT1 in AML. In particular, we found that deletion of SIRT6 or SIRT7 suppressed AML cells in vitro. SIRT6/7 has been shown to interact with and deacetylate p53 (29, 30) to attenuate p53-dependent apoptosis (27, 28). Consistently, we showed that NMNAT1 deletion increased p53 acetylation and expression of p53 target genes involved in apoptosis. Moreover, deletion of TP53 in NMNAT1-deficient AML partially suppressed the increased apoptosis observed in NMNAT1-deficient cells. We note that the rescue by TP53 deletion was partial and do not exclude the possibility that other NAD+-dependent enzymes, such as the PARPs or NAD+-dependent dehydrogenases, are also affected by NMNAT1-mediated NAD+ biosynthesis. Our findings nonetheless demonstrate that a previously unidentified pathway consisting of NMNAT1-SIRT6/7-p53 mediates cell survival of AML.
A recent paper demonstrated that NAM mediates resistance to venetoclax in relapsed/refractory AML (45), which is consistent with our findings that NAD+ metabolism confers venetoclax resistance in AML. Jones et al. demonstrated that LSCs from relapsed/refractory AML have higher NAM and NAD+ levels than de novo AML LSCs, and that NAM promotes amino acid uptake and catabolism by the TCA cycle, a mitochondrial metabolic pathway suppressed by venetoclax (45, 46). Conversely, LSCs from relapsed/refractory AML were more sensitive to NAMPT inhibition than those from de novo AML. The mechanisms by which cells maintain mitochondrial NAD+ remains unclear, given that deletion of NMNAT3, which was considered to be exclusively localized to the mitochondria, did not affect mitochondrial NAD+ levels in mice (25, 47). Our study with mouse models does not distinguish the effects of targeting NAD+ biosynthesis on de novo and relapsed/refractory AML. However, our finding that TP53-mutant AML, which are often refractory to treatments (48, 49), still requires NMNAT1 suggests that relapsed/refractory AML are dependent on NMNAT1-mediated NAD+ homeostasis, consistent with (45). Our data supports the model that impairing nuclear NAD+ homeostasis by targeting NMNAT1 activates TP53, which sensitizes cells to venetoclax (32, 33, 36). NAD+ in other cellular compartments such as the cytosol and mitochondria is also likely to promote cellular homeostasis in AML. Our findings that NMNAT1 is dispensable for HSCs provide a rationale to target nuclear NAD+ homeostasis as a therapeutic liability of AML.
MATERIALS AND METHODS
Mice
Mice were housed in The Association for Assessment and Accreditation of Laboratory Animal Care International (AAALAC)-accredited, specific pathogen–free animal care facilities at the Baylor College of Medicine (BCM). All procedures were approved by BCM Institutional Animal Care and Use Committees. Nmnat1fl mice (39) were obtained from R. Chen at BCM and crossed with the Mx1-Cre transgenic mice (JAX stock: 003556) (50). For mouse genotyping, tail biopsies at the time of weaning were obtained and dissolved in digestion buffer [10 mM tris-HCl with pH 8.0, 1 mM EDTA, and 25 mM NaCl, supplemented with proteinase K (200 μg/ml)] for 30 min at 55°C, followed by 95°C for 3 min to inactivate proteinase K. Extracted DNA was used as a template for PCR genotyping with the following primers: Nmnat1 forward (F1), TCATGTAGGGAACTCAGAGCTGGT; Nmnat1 reverse 1 (R1), TTTCCCACGTATCCACTTCC; Nmnat1 reverse 2 (R2), TGAAAGAGGCAAGGGCTTAG; Mx1-Cre forward, CGTACTGACGGTGGGAGAAT; and Mx1-Cre reverse, CCCGGCAAAACAGGTAGTTA. The Nmnat1 PCR products are 790, 622, and 547 base pairs (bp) for the floxed, WT, and KO alleles, respectively. The PCR product for Mx1-Cre is 166 bp. C57BL/6J (CD45.2) or B6.SJL-Ptprca Pepcb/BoyJ (CD45.1) mice were used for murine AML transplantation assays. NOD.Cg-Prkdcscid Il2rgtm1Wjl Tg(CMV-IL3,CSF2,KITLG)1Eav/MloySzJ (NSG-SGM3) (43) were purchased from the Jackson laboratory (JAX stock: 013062) and used for transplanting human cells from AML patents or the MOLM13 cell line. Mice 8 to 12 weeks of age of both sexes were used, and experimental mice were separated by sex and housed with up to five mice per cage.
Human subjects
All procedures involving the use of human samples were approved by the BCM Institutional Review Board (IRB) committee (protocol H-43877). Human AML BM samples were collected under LAB01-473 protocol (approved by the MD Anderson IRB committee) from patients who consented to participate in the MD Anderson tissue banking protocol, described previously (41, 42). Cord blood samples for CD34+ HSPC enrichment were obtained from the MD Anderson Cancer Center.
Cell lines
The 293T cells were purchased from American Type Culture Collection (catalog no. CRL-3216) and cultured in Dulbecco’s modified Eagle medium (DMEM). The leukemia cell lines MOLM13 and OCI-AML2 cells (from M. Goodell) were cultured in RPMI-1640 or minimum essential medium α, all supplemented with 10% fetal bovine serum (FBS) and 1% penicillin/streptomycin (Pen/Strep) (all reagents from Gibco). Cells were cultured in a humidified atmosphere containing 5% CO2 at 37°C. All cell lines tested negative for mycoplasma using a PCR-based method.
Whole-genome CRISPR screening
Whole-genome CRISPR screening was performed as previously described, with minor modifications (51). First, lentiviral stocks of Cas9 (Addgene no. 68343, pKLV2-EF1aBsd2ACas9-W), Cas9 reporters (Addgene nos. 67979 for negative control and 67980 for targeting GFP expression), and a whole-genome sgRNA library (Addgene no. 67989) were generated by transfecting 293T cells with 5.4 μg of transfer plasmid, 5.4 μg of psPAX2 (Addgene no. 12260) packaging plasmid, and 1.2 μg of pMD2.G (Addgene no. 12259) envelope plasmid in a 10-cm culture plate using a polyethyenimine (PEI) transfection protocol. Sodium butyrate (5 mM) was added into the 293T cells 24 hours after transfection to increase lentivirus production. Culture medium was collected at 48 and 72 hours after transfection, pooled together, passed through a 0.45-μm filter, precipitated with polyethylene glycol, molecular weight 6000 (PEG-6000) solution [PEG-6000 (80 mg/ml), 100 mM NaCl, and 10 mM Hepes-NaOH (pH 7.4)], and resuspended in culture media. We transduced leukemia cell lines including MOLM13 with the Cas9 lentivirus and performed blasticidin selection (10 μg/ml) 3 days after transduction to select for Cas9-expressing cells. After selection, the Cas9-expressing MOLM13 cells were single cell–sorted into 96-well plates and expanded. We functionally analyzed clonally derived Cas9-expressing cell lines by transduction with Cas9 reporter lentiviral vectors (Addgene nos. 67979 for negative control and 67980 for targeting GFP expression). We analyzed the ratio of blue fluorescent protein–positive (BFP+) single-positive and GFP+BFP+ double-positive cells on a BD LSRFortessa instrument (BD) at 3 to 4 days after transduction. Clones with the highest Cas9 activity (as assessed by the frequency of GFP+BFP+ double-positive cells) were used for the screen.
We performed the whole-genome CRISPR screen by transducing 3 × 10⁷ Cas9-expressing MOLM13 cells with the genome-wide sgRNA lentivirus at a transduction efficiency of 25 to 35% at 3 days after transduction, which was measured by BFP expression to achieve an average coverage of more than 100× per sgRNA. Three independent infections were conducted for both Cas9-expressing and Cas9-negative MOLM13 cells. Three days after transduction, the cells were treated with puromycin (1.5 μg/ml; Sigma-Aldrich) for 4 days. Approximately 108 cells were harvested at day 10 after transduction for Cas9-negative MOLM13 cells to obtain input genomic DNA (gDNA). Cas9-expressing cells with the sgRNA library were cultured for up to 25 days with 5 × 10⁷ cells being seeded at every passage and 108 cells harvested for gDNA extraction. We collected cells at days 10 and 25 for sequencing. gDNA was purified by phenol-chloroform extraction and ethanol precipitation, and 130 mg of gDNA was used to amplify sgRNA inserts using KAPA HiFi HotStart DNA Polymerase (Kapa Biosystems) with the primers listed in table S5. Illumina adapters (Illumina) were added during the second round of PCR. Resulting PCR products were purified and sequenced on a NextSeq500 sequencer (Illumina). We counted the numbers of reads for each guide with an in-house script. Enrichment and depletion of guides and genes were analyzed using MAGeCK (19).
Cloning and competitive growth assay in vitro
The cloning of individual sgRNA into pKLV2-U6gRNA5(Bbs I)-PGKpuro2ABFP-W (Addgene no. 67974) was performed with a Bbs I enzyme [New England Biolabs (NEB)]. The cloning of dual sgRNAs targeting NMNAT1 and TP53 into pKLV2.2-mU6gRNA5(Sap I)–hU6gRNA5(Bbs I)–PGKpuroBFP-W (Addgene no. 72667) was performed with Bbs I and Sap I enzymes (NEB). Site-directed mutagenesis was performed to generate Nmnat1 (H24A and W170A) and p53 (K320R/K373R/K381R) mutants and cloned into pMSCV-3xFLAG-IRES-GFP. All inserts were verified by Sanger sequencing. Lentiviral and retroviral vectors were prepared by transient transfection of 293T cells. Cas9-expressing MOLM13 cells were transduced with Nmnat1 or TP53 retroviral vectors and GFP+ cells were sorted. We transduced Cas9-expressing leukemia cell lines with the lentivirus at a transduction efficiency of about 30 to 50% at 4 days after transduction by measuring BFP expression. The relative competitive growth in sgRNA/BFP+-transduced cells versus BFP− cells was monitored over 3 weeks by flow cytometry and normalized to that at day 4 after transduction. We gated live cells with propidium iodide (PI).
Flow cytometry
All BM or PB cells were prepared and analyzed as described previously (6, 52). BM cells were isolated by crushing the long bones (tibias and femurs), pelvic bones, and spine with a mortar and pestle in Hank’s buffered salt solution (HBSS) without calcium and magnesium, supplemented with 2% heat-inactivated bovine serum (Gibco). Cells from BM or PB were filtered through a 100-μm nylon screen (Sefar America) to obtain single-cell suspension and then stained with antibodies.
To identify HSC (CD150+CD48−/lowLineage−Sca-1+c-kit+), MPP (CD150−CD48−/lowLineage−Sca-1+c-kit+), HPC1 (CD150−CD48+Lineage−Sca-1+c-kit+), and HPC2 (CD150+CD48+Lineage−Sca-1+c-kit+), BM cells were stained with antibodies against phycoerythrin (PE)–cyanine 5(Cy5)–conjugated anti-CD150, PE-Cy7–conjugated anti-CD48, allophycocyanin (APC)–conjugated anti–Sca-1, and biotin-conjugated anti–c-kit, together with PE-conjugated antibodies against the following lineage markers: CD2, CD3, CD8, Ter119, B220, and Gr-1. We visualized biotin-conjugated antibody using streptavidin-conjugated APC-Cy7. For HSPC sorting, BM cells were positively selected for c-kit+ HSPCs with antibiotin microbeads and autoMACS (Miltenyi Biotec). To identify CMP (CD34+CD16/32−Lineage−Sca-1−c-kit+), GMP (CD34+CD16/32+Lineage−Sca-1−c-kit+), and MEP (CD34−CD16/32−Lineage−Sca-1−c-kit+), BM cells were incubated with eFluor660-conjugated anti-CD34, PE-Cy7–conjugated anti-CD16/32, PerCP-Cy5.5–conjugated anti–Sca-1, and APC-Cy7–conjugated anti–c-kit antibodies, in addition to PE-conjugated lineage antibodies as above. To analyze hematopoietic lineage composition in BM or PB, red blood cells were lysed with an ACK buffer (Thermo Fisher Scientific), and the remaining mononuclear cells were stained with APC-conjugated anti-CD11b and PE-Cy7–conjugated anti–Gr-1 for myeloid cells, PE-Cy5–conjugated anti-B220 for B cells, and PE-conjugated anti-CD3 antibody for T cells. To distinguish CD45.2+ donor-derived cells in PB of competitive transplanted mice, we used APC-Cy7–conjugated anti-CD45.1 and AF700-conjugated anti-CD45.2 antibodies; the remainder of the staining was as described above.
To identify GFP+LineagelowSca-1−c-kit+CD16/32+CD34+ (L-GMP) cells from the MLL-AF9-induced AML model, BM cells were incubated with eFluor660-conjugated anti-CD34, PE-Cy7–conjugated anti-CD16/32, APC-Cy7–conjugated anti–c-kit, and PerCP-Cy5.5–conjugated anti–Sca-1 antibodies, in addition to antibodies against the following PE-conjugated lineage markers: Ter119, B220, Gr1, CD2, CD3, CD8, and CD127. To determine the frequency of AML cells, cells were gated by expression of GFP (MLL-AF9–induced AML), BFP (MOLM13 transduced with sgRNAs), or stained with APC-conjugated anti-CD45. To identify CD45+CD34+CD38− from human AML PDX models, we incubated BM cells with APC-conjugated anti-CD45, APC-Cy7–conjugated anti-CD34, and PE-conjugated anti-CD38.
We used 4′,6-diamidino-2-phenylindole (DAPI) to exclude dead cells. Flow cytometry analyses were performed using LSR II, LSRFortessa, or Aria II flow cytometers (BD).
Retroviral BM transduction
The pMIG-MLL-AF9 (Addgene no. 71443) and pMIG-MOZ-TIF2 plasmids were described previously (6). 293T cells in a 10-cm culture plate were transiently transfected with 10 μg of MSCV vectors with 5 μg of pCL-Eco (Addgene no. 12371) plasmid using a PEI transfection protocol. HSPCs (lineage−Sca-1+c-kit+) were sorted from Nmnat1 WT, Het, and KO mice and incubated for 24 hours in X-Vivo 15 (Lonza) supplemented with thrombopoietin (TPO, 50 ng/ml), stem cell factor (SCF, 10 ng/ml), interleukin-13 (IL-3; 10 ng/ml), and IL-6 (10 ng/ml) (all from Peprotech, Rocky Hill, NJ). After incubation, cells were spin-infected with concentrated retrovirus supplemented with polybrene (8 μg/ml) in retronectin (Clontech) coated plates at 1500 rpm for 45 min at room temperature.
Syngeneic transplantation
For primary transplantation assays of AML cells, approximately 50,000 HSPCs transduced with MLL-AF9 or MOZ-TIF2 retrovirus were mixed with 100,000 supporting WT BM cells and transplanted into lethally irradiated [10 grays (Gy) in a split dose with at least 4 hours interval] recipient mice. For LDA, different numbers of GFP+ AML cells (50, 500, 5000, and 50,000) were sorted from the BM of primary recipient mice, and mixed with 100,000 supporting WT BM cells before transplantation into sublethally (650 cGy, single dose) irradiated recipients. A total of 10,000 AML cells were transplanted into secondary recipient mice for NAM treatment.
For whole BM competitive transplantation assays, 500,000 BM cells from Nmnat1 WT, Het, or KO mice were mixed with 500,000 BM cells from CD45.1 mice and transplanted into lethally irradiated CD45.1 recipient mice. We analyzed these mice for up to 6 months after transplantation.
Xenotransplantation experiments
We generated the stable mouse Nmnat1 (mNmnat1) WT, H24A- or W170A-expressing MOLM13 cells through retrovirus transduction according to the protocol described above. MOLM13 cells were then transduced with NC_sg or NMNAT1_sg lentivirus (both expressing BFP) and sorted on the basis of BFP expression after 2 days after transduction, and 1 × 10⁵ cells were transplanted via tail vein injection into sublethally irradiated (250 cGy, single dose) NSG-SGM3 mice. For human patient-derived xenograft models, we injected into the tail vein of sublethally irradiated NSG-SGM3 mice (1 × 10⁵ cells per mouse) human AML samples with a t(9;11) rearrangement or FLT3-ITD mutation (table S3) after electroporation with Cas9-sgRNA ribonucleoprotein targeting ENAM (a gene involved in amelogenesis as negative control) or NMNAT1.
Colony-forming assays
Cells were cultured in MethoCult M3434 (catalog no. 03434, STEMCELL Technologies) supplemented with 1% Pen/Strep (Gibco). Single HSCs from Nmnat1 KO mice 4 months after poly(I:C) injection were sorted into 96-well plates and cultured for 7 days to form colonies, which were then used for genotyping.
Poly(I:C) and venetoclax treatments
Poly(I:C) (Amersham, Piscataway, NJ) was suspended in phosphate-buffered saline (PBS) at 50 μg/ml, and mice were injected intraperitoneally with 0.5 μg/g of body mass every other day for 6 days. AML recipient mice were treated with vehicle or venetoclax (100 mg/kg; LC Laboratories) daily by oral gavage from days 5 to 21.
Gene editing with Cas9-sgRNA ribonucleoprotein complex
sgRNA against murine Rosa26 (negative control) and Nmnat1 as well as human ENAM (negative control) and NMNAT1 were designed according to CRISPR DESIGN (http://crispr.mit.edu/). We cloned sgRNA with a T7 promoter sequence and transcribed using the HiScribe T7 In Vitro Transcription Kit (NEB, Ipswich, MA). We introduced the Cas9-sgRNA complex to murine AML cells as previously described (38, 53). In brief, 1 μg of Cas9 protein (PNA Bio, Newbury Park, CA) was incubated with 1 μg of in vitro–transcribed sgRNA at room temperature for 5 min before being electroporated for murine AML cells (105 cells per reaction) using the Neon Transfection System (MPK1096, Thermo Fisher Scientific) using the following parameters: 1700 V, 20 ms, and 1 pulse. Human AML cells were electroporated with the following parameters: 1350 V, 20 ms, and 1 pulse. Cells were then cultured for at least 12 hours before subsequent assays including transplantation, cell counting, and immunoblotting.
Cell cycle, cell apoptosis, and differentiation analyses
Cas9-expressing MOLM13 cells were transduced with sgRNA retroviruses targeting negative control or NMNAT1. We analyzed cell cycle and apoptosis on day 6 after transduction, while differentiation analyses were performed on days 6 and 11 after transduction. For cell cycle analysis, a BrdU incorporation assay was performed using a BrdU flow kit following the manufacturer’s specification (BD Pharmingen). Cells were pulsed with 10 μM BrdU for 1 hour in culture and then fixed with Cytofix/Cytoperm buffer for 30 min on ice. After permeabilization for 10 min, the cells were refixed with the Cytofix/Cytoperm buffer for 5 min on ice. Next, the cells were treated with deoxyribonuclease (300 μg/ml in PBS) for 1 hour at 37°C to expose incorporated BrdU, followed by staining with fluorescein isothiocyanate (FITC)–conjugated anti-BrdU antibody and PI for 1 hour at room temperature. We used FITC-conjugated annexin V (BD) to identify apoptotic cells. Cell differentiation analyses were performed with APC-conjugated antibodies against CD11b, CD14, CD15, or CD33.
Drug response experiments
The stock solutions of NAM (Sigma-Aldrich, catalog. no. N0636); β-NMN (Sigma-Aldrich, catalog no. N3501), NA (Selleck Chemicals, catalog no. S1744), and NR (Cayman Chemicals, catalog no. 23132) were prepared in water, and FK866 (Millipore Sigma, catalog no. 481908) and venetoclax (LC Laboratories, catalog no. V-3579) were dissolved in dimethyl sulfoxide. The drug response experiments were performed with a CellTiter 96 aqueous one solution cell proliferation assay (Promega) or by cell counting with a hemocytometer. Leukemia cells transduced with sgRNA lentiviruses were sorted on day 2 after transduction and treated with the indicated drugs at days 4 to 6 after transduction with seeding density of 104 cells in a final volume of 100 μl per well in 96-well flat-bottom plates. After 48 hours of treatment, 20 μl of Aqueous One Solution Reagent (Promega) was added into each well of the 96-well assay plates, followed by incubation at 37°C for 4 hours. Cell viability was measured by recording the absorbance at 490 nm using Infinite M200 PRO (Tecan). The viability data were normalized to that of cells treated with vehicle alone.
Primary L-GMP cells were sorted from MLL-AF9 induced AML mice and cultured in X-Vivo 15 (Lonza), supplemented with mouse IL-3 (10 ng/ml; Peprotech), 10% FBS, and 1% Pen/Strep. Human AML cells were cultured in Iscove’s modified Dulbecco’s medium (Gibco), supplemented with human SCF (100 ng/ml), granulocyte colony-stimulating factor (20 ng/ml), IL-3 (20 ng/ml), FLT3 ligand (50 ng/ml; Peprotech), 15% FBS, and 1% Pen/Strep.
Immunofluorescence staining
MOLM13 cells were fixed with cold methanol at −20°C. Cells were cytospun to a slide and blocked in PBS containing 4% goat serum, BSA (4 mg/ml), and 0.1% NP-40, followed by staining overnight at 4°C with rabbit anti-NMNAT1 antibody (1:200, no. 98354, D7O4N, Cell Signaling Technology) diluted in blocking buffer. Primary antibody staining was developed with an anti-rabbit Alexa Fluor 488–conjugated secondary antibody (1:500) together with DAPI (2 μg/ml). Slides were analyzed on a Leica DMI6000 fluorescence microscope and a LAS software.
Immunoblotting
Cells were lysed with radioimmunoprecipitation assay (RIPA) buffer supplemented with a Halt Protease and Phosphatase inhibitor cocktail (Thermo Fisher Scientific) and phenylmethylsulfonyl fluoride (PMSF; Sigma-Aldrich) for 30 min on ice, followed by centrifugation at 15,000 rpm for 10 min at 4°C to remove cell debris. Protein concentration was measured using a Pierce BCA protein assay kit (Thermo Fisher Scientific), and the lysates were then boiled at 95°C in 1× lithium dodecyl sulfate (LDS) loading buffer (Life Technologies) for 5 min. Protein were separated on a bis-tris polyacrylamide gel (Life Technologies) and transferred to a polyvinylidene difluoride membrane (Millipore). Membranes were blocked in 5% (w/v) nonfat milk in 1× PBST (PBS with 0.1% Tween-20) for 1 hour at room temperature and then incubated overnight at 4°C with the following primary antibodies: rabbit anti-NMNAT1 (no. 98354, Cell Signaling Technology, 1:1000, for detection of human NMNAT1), rabbit anti-NMNAT1 (NBP2-32107, Novus Biologicals, 1:1000, for detection of mouse NMNAT1), rabbit anti-NAMPT (no. 61122, Cell Signaling Technology, 1:1000), rabbit anti-p53 (no. 9282, Cell Signaling Technology, 1:1000), rabbit anti-p53 phospho-Ser15 no. 9284, Cell Signaling Technology, 1:1000), rabbit anti–acetylated lysine (no. 9441, Cell Signaling Technology, 1:1000), rabbit anti-FLAG M2 (no. 2368, Cell Signaling Technology, 1:1000), rabbit anti-γH2AX Ser139 (no. 2577, Cell Signaling Technology, 1:1000), rabbit anti-SirT6 (no. 12486, Cell Signaling Technology, 1:1000), rabbit anti-SirT7 (no. 5360, Cell Signaling Technology, 1:1000), and mouse anti–β-actin (A1978, Sigma-Aldrich, 1:2000). After incubation with appropriate anti-mouse or anti-rabbit horseradish peroxidase–conjugated secondary antibodies (Cell Signaling Technology, 1:5000 to 1:10,000), we detected and acquired signals with a SuperSignal West Pico PLUS Chemiluminescent Substrate (Thermo Fisher Scientific, catalog no. 34580) and a KODAK X-OMAT 2000 Processor (Kodak).
Immunoprecipitation
We obtained protein lysates as described above. Primary antibodies or appropriate control immunoglobulin G was incubated with Protein G magnetic beads (Thermo Fisher Scientific) for 1 hour at 4°C, washed twice with RIPA buffer, and incubated with protein lysates overnight at 4°C. The beads were washed three times, resuspended in 1× LDS loading buffer, boiled for 5 min, and analyzed by immunoblotting.
NAD+/NADH measurement
We measured intracellular or nuclear NAD+/NADH levels using a NAD+/NADH Colorimetric Assay Kit Ver. 2 (CY-1253 V2, MBL) according to the manufacturer’s instructions. To measure nuclear NAD+, cells were incubated with Triton X-100 extraction buffer [PBS containing 0.5% Triton X-100 (v/v), 2 mM PMSF, 0.02% NaN3 (w/v), 1 mM DDT, and 1× Halt Protease and Phosphatase inhibitor cocktail (at a cell density of 107 cells/ml)] on ice for 10 min, followed by centrifugation for 10 min at 1000g at 4°C to isolate pelleted nuclear fractions. Cells or the nuclear fractions were incubated with NAD+ extraction solution (0.5 M HClO4) on ice or with NADH extraction solution (50 mM NaOH and 1 mM EDTA) at 60°C for 30 min, followed by neutralization with 0.55 M K2CO3 (for NAD+ measurement) or 0.3 M potassium phosphate buffer (pH 7.4, for NADH measurement). The neutralized cell extracts were centrifuged at 15,000 rpm for 5 min at 4°C. The supernatants were incubated with NAD+/NADH reaction mixture and the reading was taken at 450-nm absorbance. Data were normalized on the basis of protein concentration and expressed as picomole NAD+ per milligram of protein or as a ratio of NAD+/NADH.
RNA-sequencing analysis
MOLM13 cells 4 days after NMNAT1 deletion were sorted into TRIzol, and RNA were extracted using a RNeasy MinElute Cleanup kit (QIAGEN, Hilden, Germany) according to the manufacturer’s instructions. Complementary DNA (cDNA) libraries were generated using the Smart-seq2 protocol. Sequencing libraries were generated from 250 pg of amplified cDNA using a Nextera XT kit according to the manufacturer’s instructions. Barcoded libraries were purified and sequenced on a NextSeq platform. Raw sequencing data were converted to fastq files and aligned to the reference genome (hg38) using the Spliced Transcripts Alignment to a Reference (STAR) algorithm. DESeq2 was used for data processing, normalization, and differential expression analysis.
Quantitative real-time PCR
Cells were sorted into TRIzol (Thermo Fisher Scientific), and RNA was isolated according to the manufacturer’s instructions. cDNA was made with random primers and SuperScript IV reverse transcriptase (Thermo Fisher Scientific). We performed quantitative PCR using ViiA7 Real-Time PCR System (Thermo Fisher Scientific) with a SYBR Green master mix. Analysis was performed in triplicate by the 2−ΔΔC(T) method, and β-actin or GAPDH was used as the housekeeping gene. Primers are listed in table S5.
Integrating metabolites and drug sensitivity in cancer cell lines
We downloaded the IC50 value for each drug of cancer cell lines (GDSC1 and GDSC2) from the GDSC (Genomics of Drug Sensitivity in Cancer) database (https://cancerrxgene.org/) (34). The intracellular metabolites level in cancer cell lines were from a previously published paper (35). We filtered out nonhematological malignancy cell lines. Calculation of Pearson correlations, P values, and visualization were performed using R. The correlation heatmap was row sorted by the row-wise sum of correlations.
Dependency scores for NAD+ biosynthesis genes
The dependency scores for NAD+ biosynthesis genes were downloaded from the DepMap dataset (https://depmap.org/portal/) and further analyzed on the basis of subsets of hematopoietic malignancies, including leukemia, lymphoma, and multiple myeloma.
Quantification and statistical analysis
Data were analyzed with Stata, and the figures were generated with Prism software (GraphPad) and were presented as the mean ± SD, unless otherwise stated. Paired or unpaired Student’s t test (two sided), Pearson’s χ2 test, or Mantel-Cox log rank were performed to determine statistical significance. Statistical details are described in the figure legends with the information of the number of replicates or animals per group (denoted by “n”) and P values where relevant. *P < 0.05, **P < 0.01, and ***P < 0.001. No randomization or blinding was used in any experiment. Experimental mice were not excluded from analysis in any experiment. Sample sizes were selected on the basis of previous experience with the degree of variance in each assay. For immunoblotting blot results, representative figures from two or three biological replicates are shown.
Acknowledgments
This work was supported by the NIH (R01CA193235 and R01DK107413) and the Edward P. Evans Foundation. X.S. and D.N. are a Special Fellow (Grant ID: 3400-20) and a Scholar of the Leukemia and Lymphoma Society, respectively. Y.J. was supported by training grants from the NIH and CPRIT (T32DK060445 and RP160283). T.H. was supported by a training grant from CPRIT (RP160283). R.L.M. was supported by a training grant from the NIH (F31DK112542). Flow cytometry was partially supported by the NIH (NCRR grant S10RR024574, NIAID AI036211, and NCI P30CA125123) for the BCM Cytometry and Cell Sorting Core. Sequencing was supported in part by the Genomic and RNA Profiling Core at BCM with funding from the NIH NCI grant (P30CA125123). We thank C. Gillespie for critical reading of the manuscript. Author contributions: Conception and design—X.S. and D.N.; development of methodology and acquisition of data—X.S., Y.J., A.K., T.H., R.L.M., Y.L., K.A.H., R.C., and D.N.; analysis—X.S., Y.J., A.K., T.H., R.L.M., Y.L., K.A.H., K.T., and D.N.; visualization—X.S., K.A.H., and D.N.; and writing—X.S. and D.N. Competing interests: The authors declare that they have no competing interests. Data and materials availability: All data needed to evaluate the conclusions in the paper are present in the paper and/or the Supplementary Materials. The RNA-seq data are deposited to the NCBI GEO (GSE171565). Additional data related to this paper may be requested from the authors.